How We Used PlanetScale MCP to Cut Query Latency

Xav
Co-Founder & CTO
HelixDB runs graph and vector queries in our own database engine. PlanetScale backs the control plane around it: workspaces, projects, provisioning, billing, and the telemetry behind Query Insights.
Some of our control plane queries run every few seconds, 24/7. If they use too many resources or take too long, they increase database load and delay Query Insights and billing updates. We wanted to find and optimise these hotspots quickly.
Finding the hidden scan
PlanetScale Insights showed that one of our most expensive query groups was a cursor over our query event ledger. The worker reads new events in order using a timestamp and an event ID:
(received_at, event_id) > (?, ?)The table already had a composite index on (received_at, event_id), so the query looked correct. However, MySQL and Vitess did not use the tuple comparison as a narrow index range. It became an attached filter and scanned the full index.
The same cursor appeared in two important paths: the worker that builds Query Insights and the worker that rolls query activity into billing usage. Fixing only one would have left the other scan running.
Debugging with the PlanetScale MCP server
We connected Codex to PlanetScale through its MCP server. The agent could inspect current Insights data, retrieve the live schema, and run read-only diagnostic queries without exporting a database dump or leaving the code environment.
This changed the debugging loop. The agent could:
-
find the query with the highest cumulative cost
-
inspect the index that should have served it
-
map the normalized SQL back to the exact Go workers in our backend
-
benchmark possible changes before editing production code
The first idea was a broader CTE rewrite that combined more of the Query Insights work. It looked cleaner, but a representative 100,000-event benchmark showed that it was slower: about 2.41 seconds instead of 1.28 seconds.
We rejected it.
That is one of the most useful parts of giving an agent access to real database evidence. It doesn't have to guess or hallucinate, it can just test the idea, see that it is worse, and move on.
The smaller fix was the faster fix
We kept the existing cursor and changed only its range predicate:
received_at > ?
OR (received_at = ? AND event_id > ?)
The explicit scalar ranges let MySQL and Vitess use the existing composite index as an index range. We made the same change in both workers and added regression tests for events that share the same timestamp, including batches of one. This proved that the cursor would not skip or count an event twice.
On our 100,000-row fixture, EXPLAIN ANALYZE changed from scanning 100,000 index rows in about 7.73 ms to an index range with a two-row estimate in about 0.008 ms. That measurement covers the scan step rather than an end-to-end request, but it shows the amount of wasted database work that we removed.
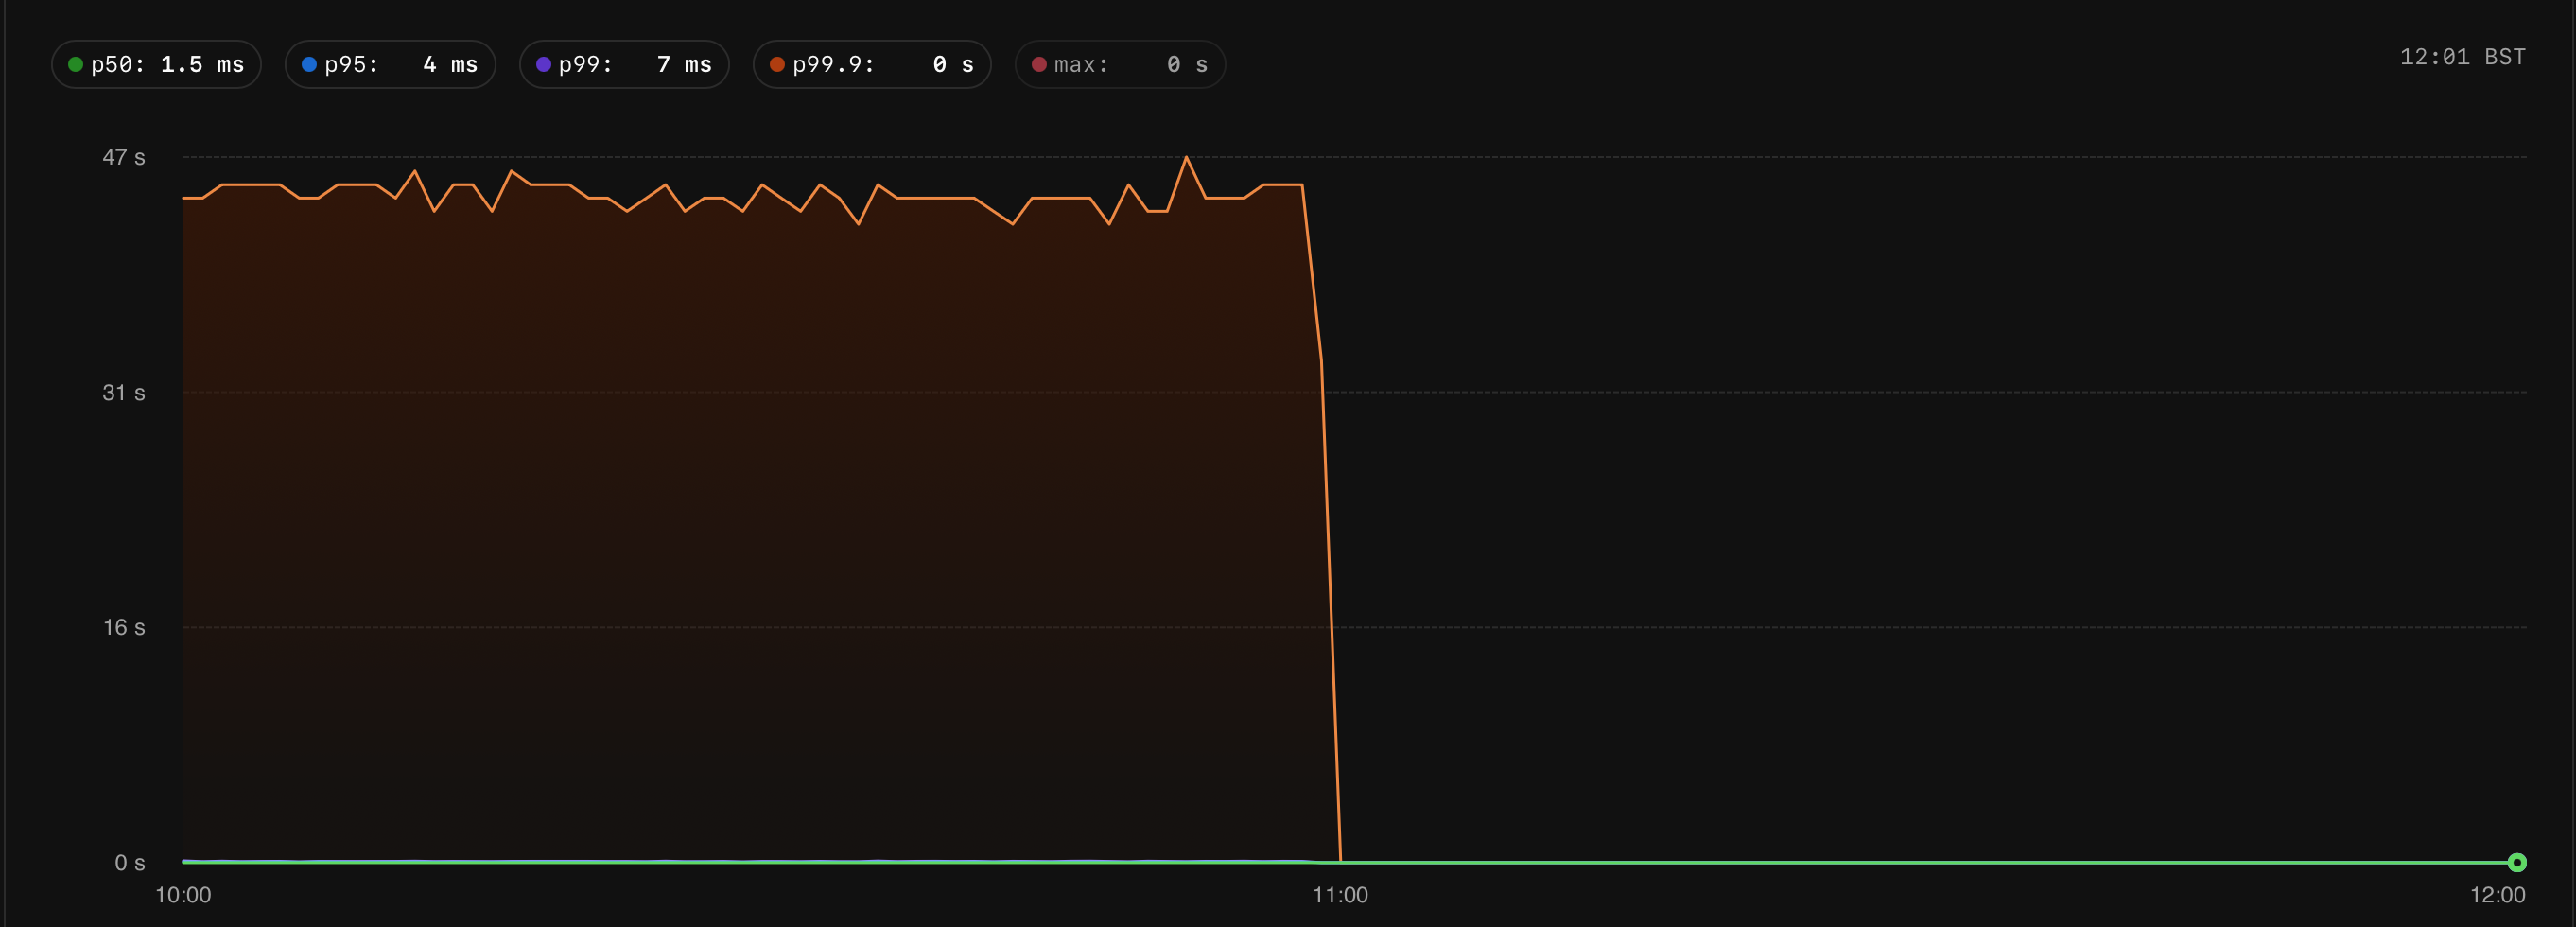
The database-wide percentiles moved at the same boundary. p95 fell from roughly 45 ms to 4 ms and p99 fell from roughly 90 ms to 7 ms, while p50 remained near 1.5 ms. The p99.9 fell from ~47s (yes seconds!) to ~9ms
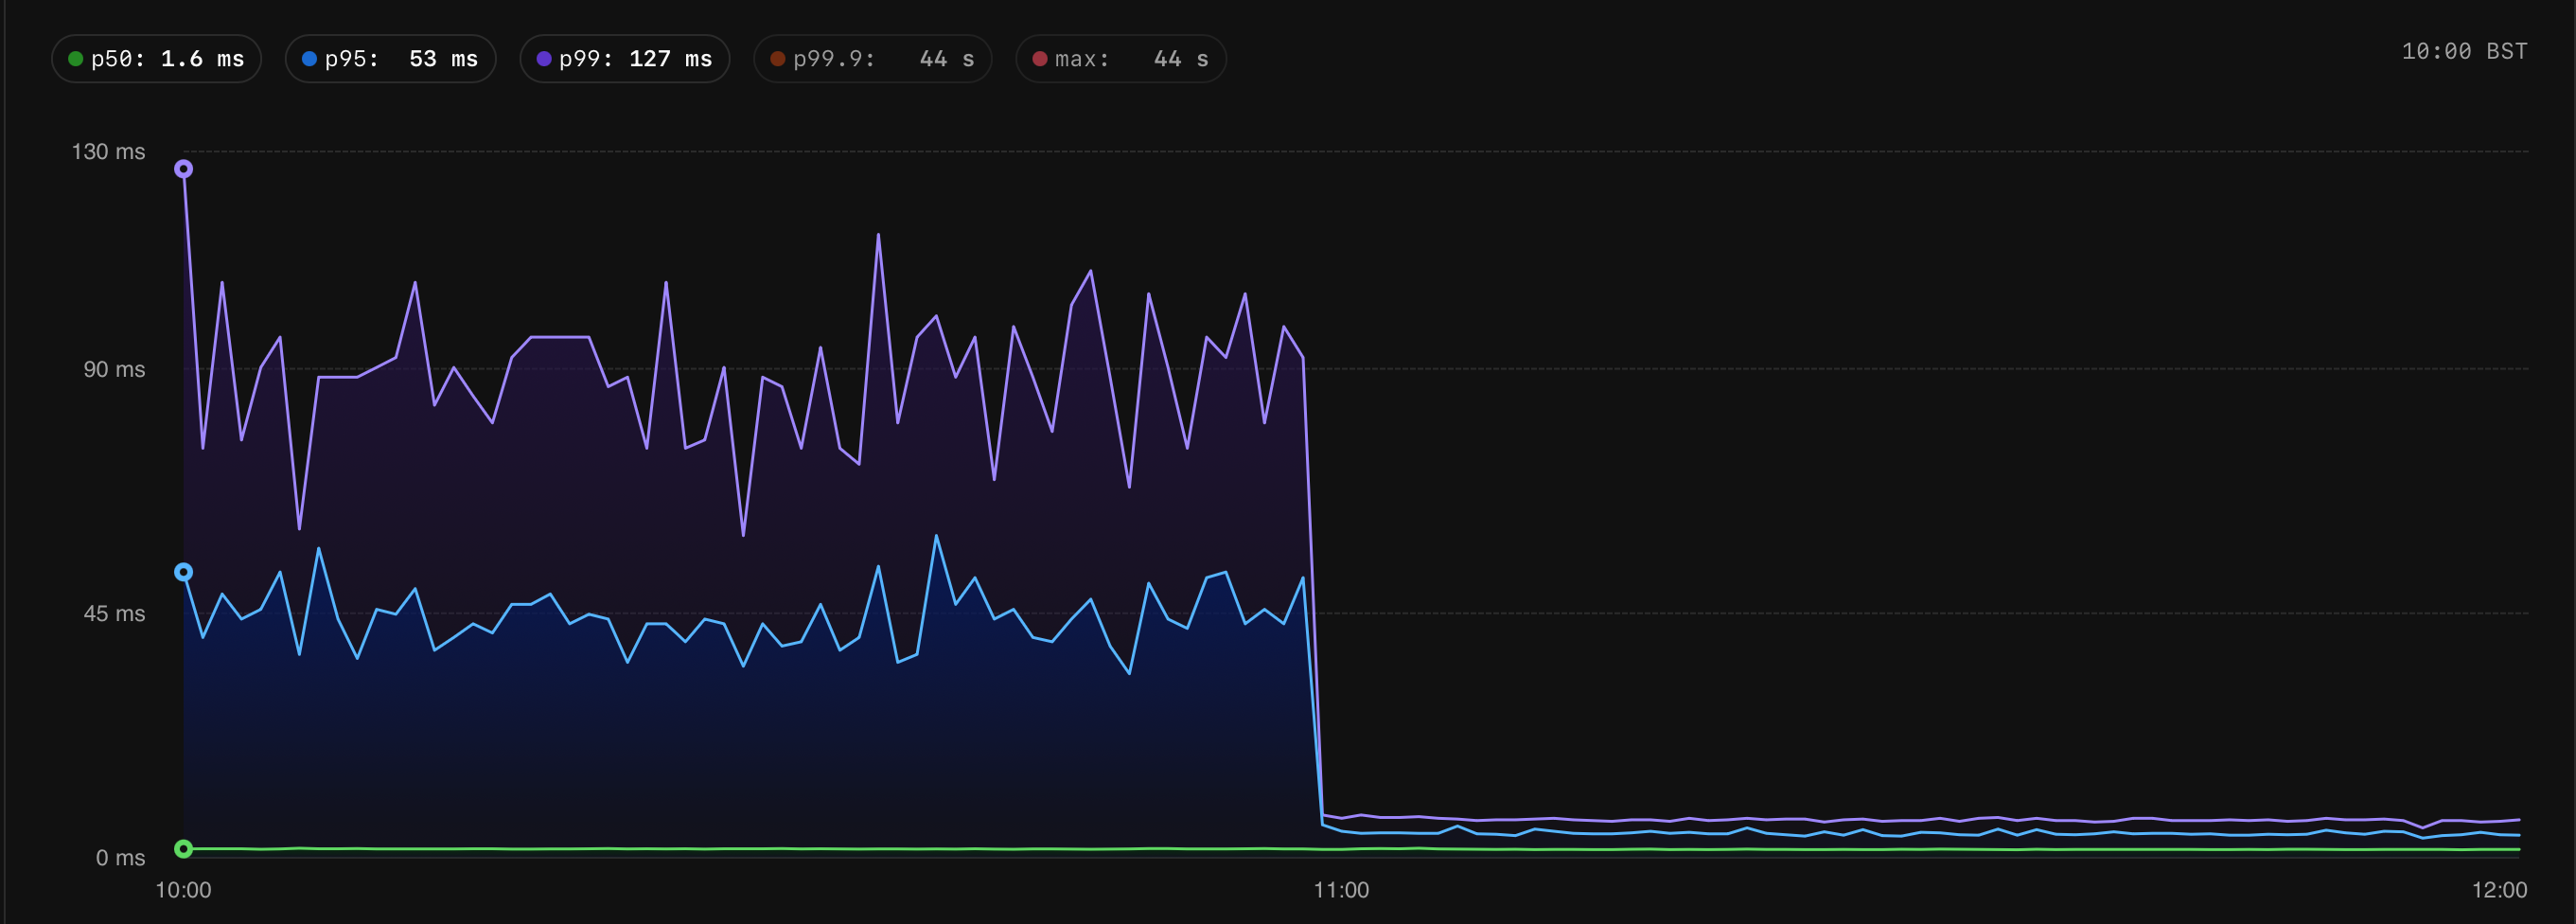
Database-wide latency percentiles before and after the change.
MCP changed how we operate the database
Rather than manually trawling through SQL queries, metrics, recommendations, schemas and indexes, then manually testing changes locally and then on a development branch we now just give an agent access to the MCP and it can just go about collecting evidence, creating branches, testing changes and running tests all on its own.
This also fits very well into out workflow because the Planet Scale MCP gives us control over what the agent can do meaning we can send it on long running goals with full confidence its not going to change and configurations, change the schema or drop any data.
As a company building our own database, all of this allowed us to focus on building our actual product and ship quicker, without giving up good DevOps or security.