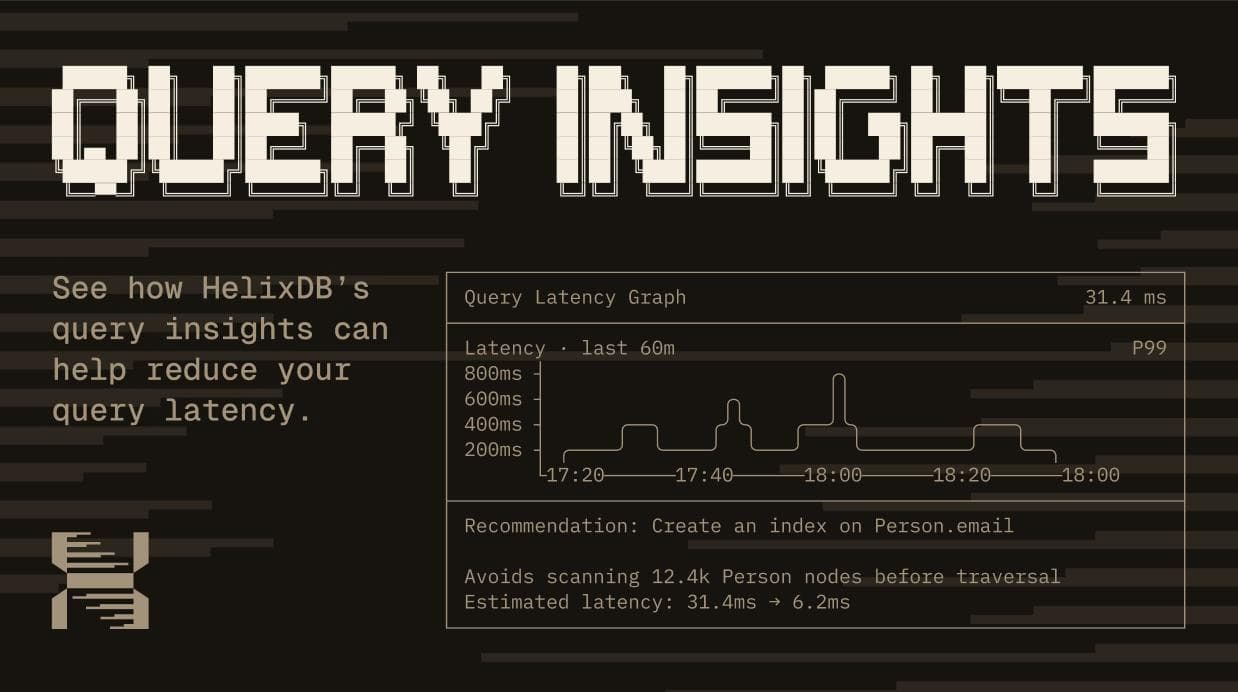
Introducing HelixDB Query Insights

Xav
Co-Founder & CTO
Today we are launching Query Insights in HelixDB Cloud.
Knowing that a query is slow is easy. Knowing why it is slow is much more annoying.
Helix queries can combine graph traversals, filters, vector search, and full-text search. A query can look completely reasonable but still do far too much work because it is missing an index, starts from the wrong place, or expands much more of the graph than expected. This also changes as your graph grows, so a query that was fast a month ago may not be fast today.
Until now, working this out meant jumping between metrics, logs, and query code. With Query Insights, you can see everything in one place, and get automatic recommendations for how to fix and improve your queries.
What is Query Insights?
Query Insights shows how queries are actually performing against your database.
The latency graph shows p50, p95, p99, and maximum latency over the last hour, six hours, 24 hours, or seven days. You can look at the database as a whole, compare query groups, or select one query and inspect it on its own.
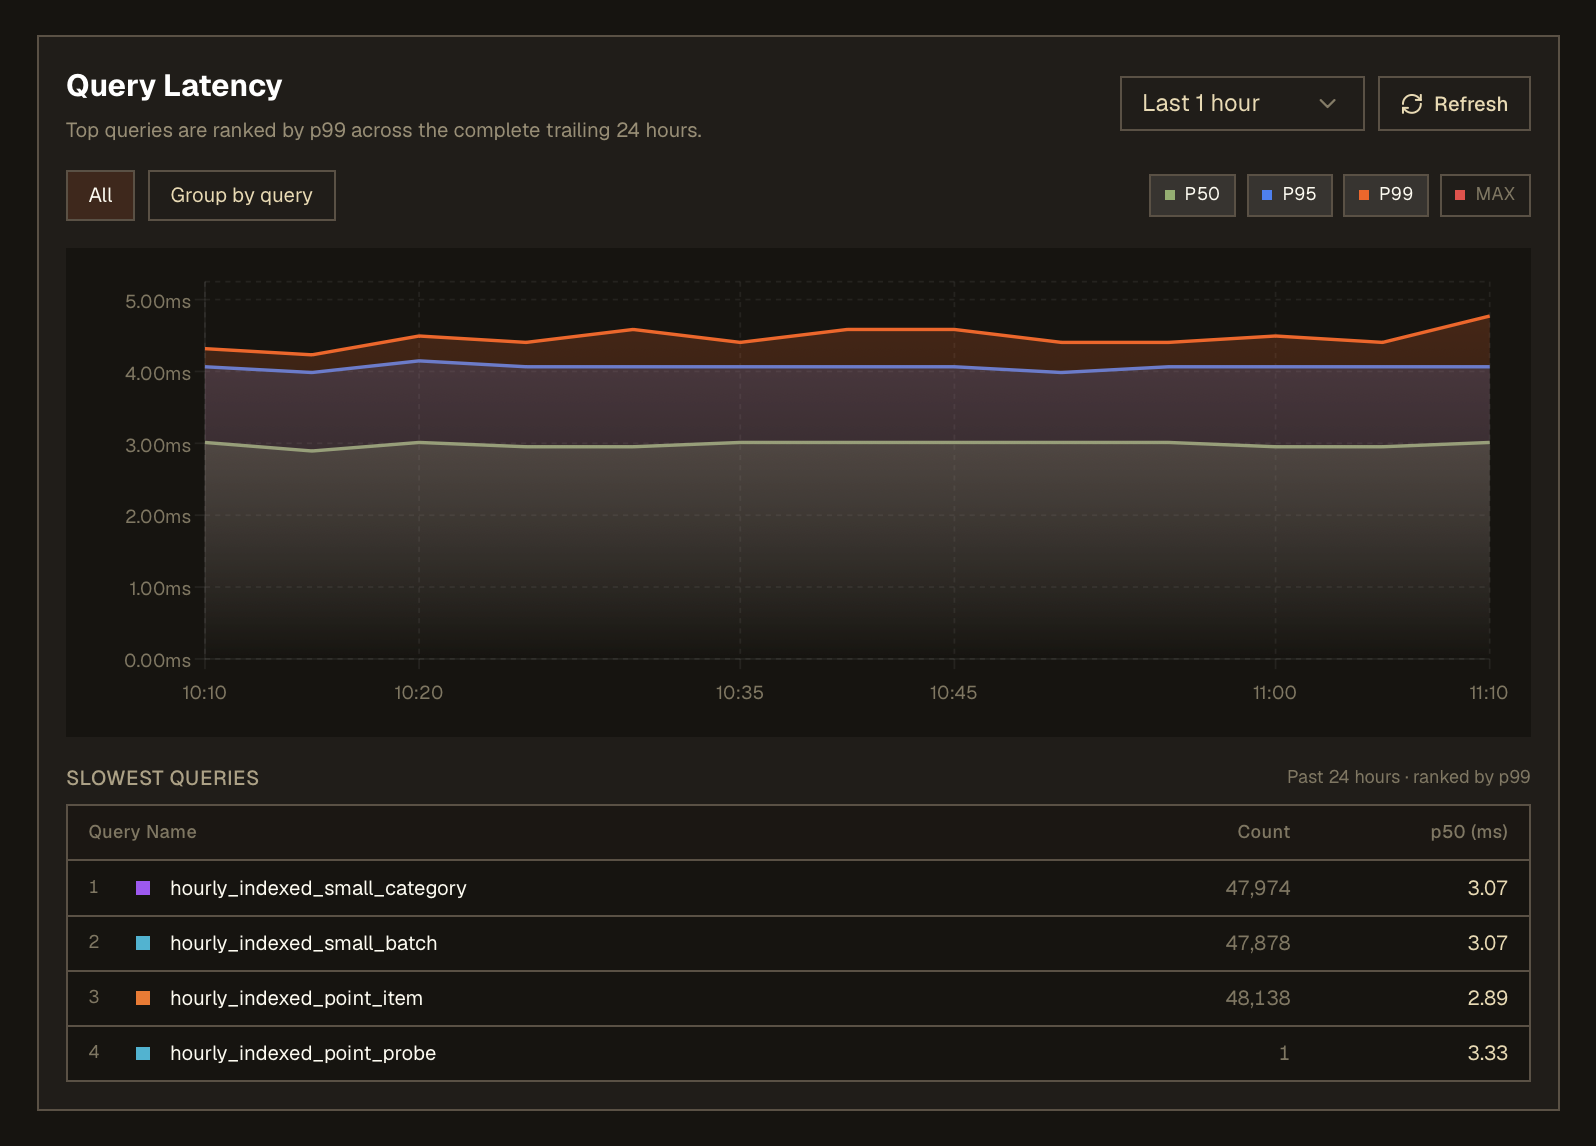
See p50, p95, p99, and maximum latency alongside the queries affecting it.
All of this is scoped to the database you are looking at. Dedicated clusters show their own query traffic, while databases hosted on shared or dedicated infrastructure only show their own tenant data.
What are Query Recommendations?
We use the query planner's statistics, cache metrics, query metrics and a redacted version the query plan to generate recommendations when a query is performing slowly. Recommendations are generated automatically and use our own AI agent to understand why a query is slow and what changes can be made to improve it. Once you deploy a fix by following a recommendation you can resolve the issue and see that the query's latency has improved.
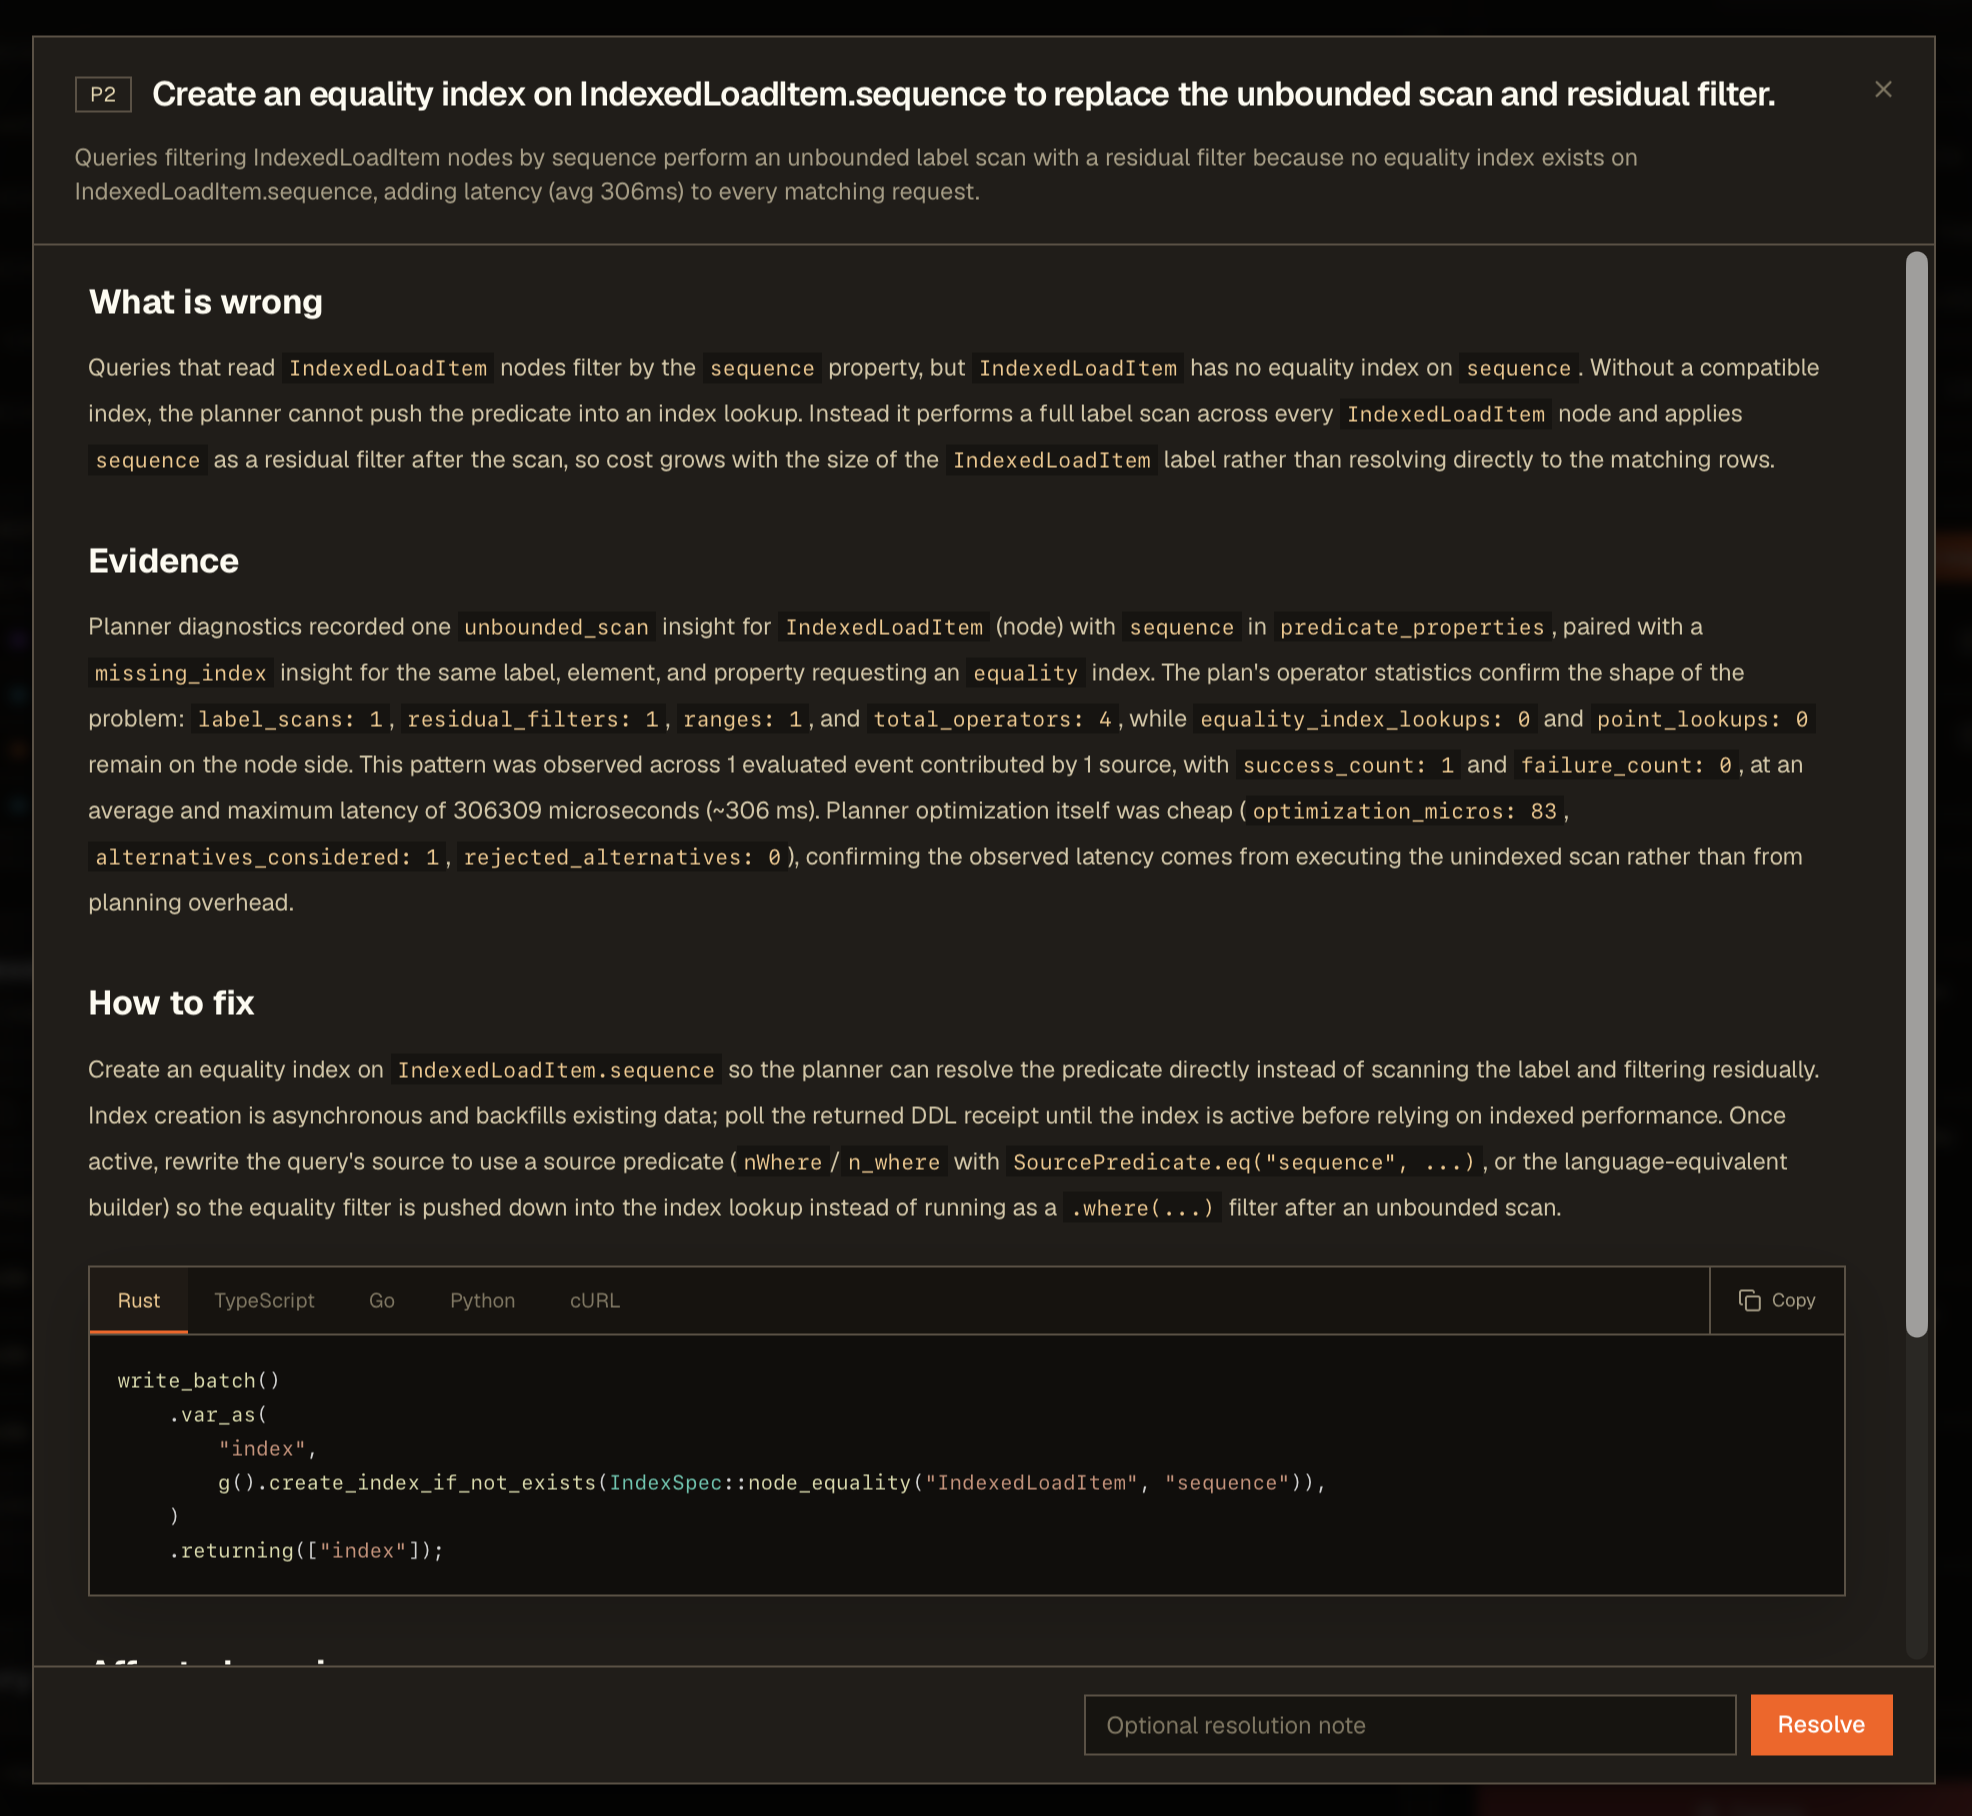
Helix explains what is wrong, shows the planner evidence, and generates the fix for every supported SDK.
The most common reasons for slow queries we see Query Recommendations being generated for are:
-
Missing equality or range indexes
-
Unbounded node or edge scans
-
Deep graph traversals and repeats
-
Queries optimizations that can be made
We will continue to improve and expand the quality and coverage of Query Recommendations.
Workspace owners and admins can always turn AI recommendations off in the workspace settings.
Use Query Insights from your agent
Query Insights is also available through our hosted HelixDB MCP server.
This means you can ask Codex, Cursor, Claude Code, or another MCP client to find your slowest queries, inspect their planner findings, check the indexes that are actually active, and then compare all of that with the query code in your repository.
The MCP server is read-only. It can inspect query performance, indexes, recommendations, usage, and cluster health, but it cannot run queries or change your database.
Get started
Open a database or dedicated cluster in the Helix dashboard and scroll to Query Latency. The graph starts with the last 24 hours, with the slowest query groups listed directly underneath it.
We built Query Insights to make query performance much less of a guessing game. You can see what is slow, understand why the planner chose that path, make the fix, and then check whether it actually worked.